Satellite Crop Monitoring: See Your Field From Space, Then Ask Anee
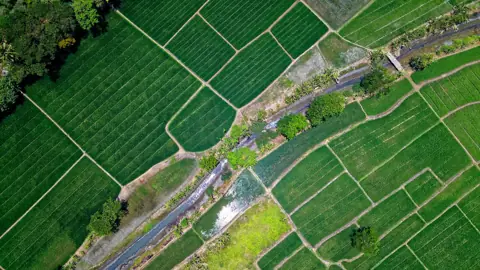
Satellite crop monitoring in anee.io starts with a field you draw on the map. Satellite Analysis reads the newest clear Sentinel 2 picture and the latest Sentinel 1 radar pass of that field. Then Anee, your smart farm technician, weighs the weather and the soil of your area and tells you where to walk first.
How satellite crop monitoring works in anee.io
Tell Anee about the field
Type the town or use where you stand. Pick the crop and, if you know it, the variety. Add the planting date, how it went in, the water and what you know of the soil.
Say what worries you
Pick any that fit, like yellowing, gaps, lodging or standing water. Anee looks hardest where you point. A routine check is fine too.
Draw the field
Tap each corner of the field on the satellite map, in order around it. Drag a corner to fix it. The area in hectares shows as you draw.
Run it
The run reads both satellites, then the weather and the soil. After that Anee writes the report, in about two minutes.
What the satellites see
Sentinel 2 takes pictures in visible and infrared light at 10 meters a pixel. From them the app works out NDVI, a greenness score from 0 to about 0.9. Bare or flooded ground sits near 0 to 0.2, and a full green canopy reads 0.6 to 0.9. Clouds and their shadows never count, because the app masks them pixel by pixel.
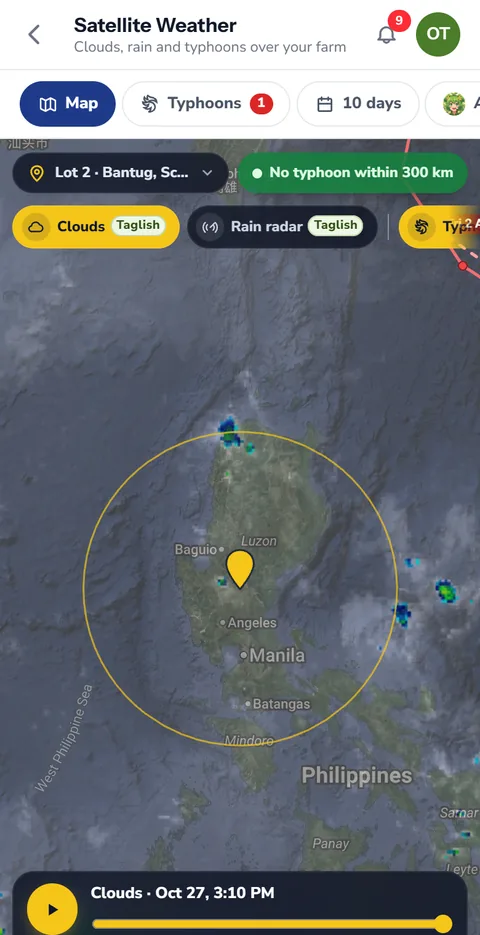
Sentinel 1 is radar, and radar sees through cloud. Its VH signal rises as leaves and stems fill in. So when a typhoon hides your field from Sentinel 2, the report says so and reads the crop from radar alone.
The field in nine parts
The app cuts your field into a three by three grid and reads each part on its own. A weak corner shows up as a weak cell, so the report can say 'the south east corner reads lower' instead of one flat average. It also draws the last 90 days of greenness and radar.
What Anee adds to the picture
A satellite number alone does not tell you what to do. So before Anee writes, the app gathers the rain of the last 30 days and the forecast for the next 16. It adds the same weeks of each of the last twenty years and the El Niño or La Niña outlook. Then comes the modelled soil at the spot from ISRIC SoilGrids. Finally, Anee searches the web for soil studies of your area and its record of typhoons, floods and drought.
The report opens in tabs:
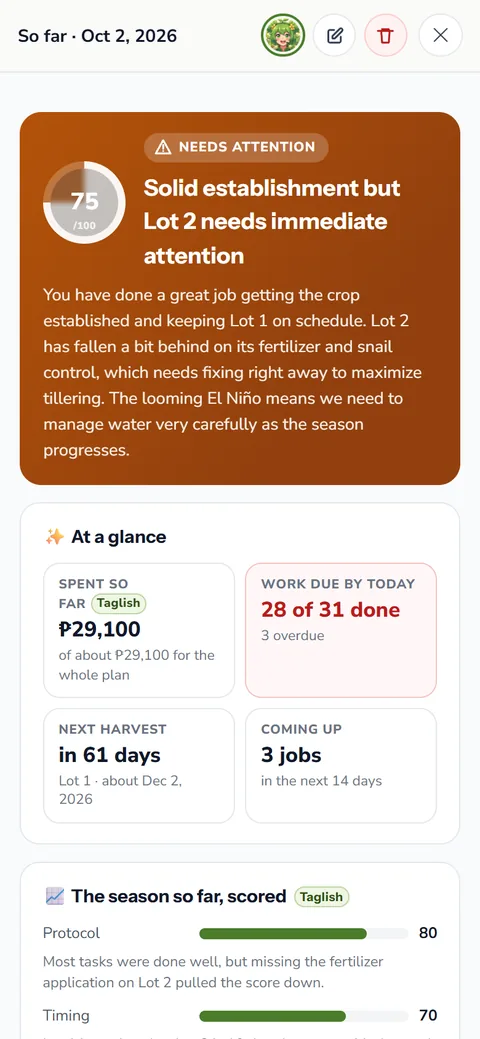
- Overview: a health score out of 100, the stage she reads, and how even the stand is
- Map: the NDVI heatmap, the true color picture and the radar layer over your outline
- Crop health: weak spots, their likely cause and what to check on foot, plus the disease risk
- Radar: the VV and VH readings and their 90 day trend
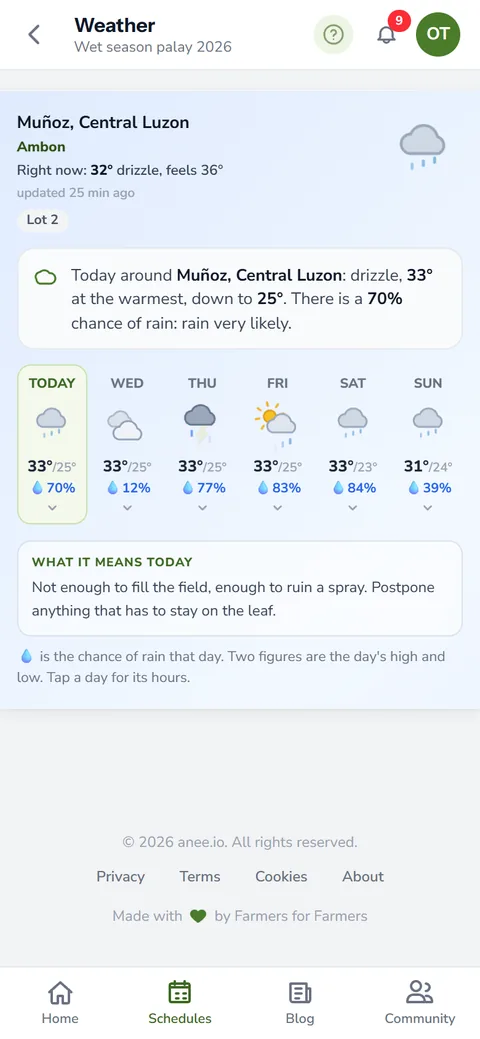
- Threats and weather: the next 10 days, ENSO and what earlier years brought
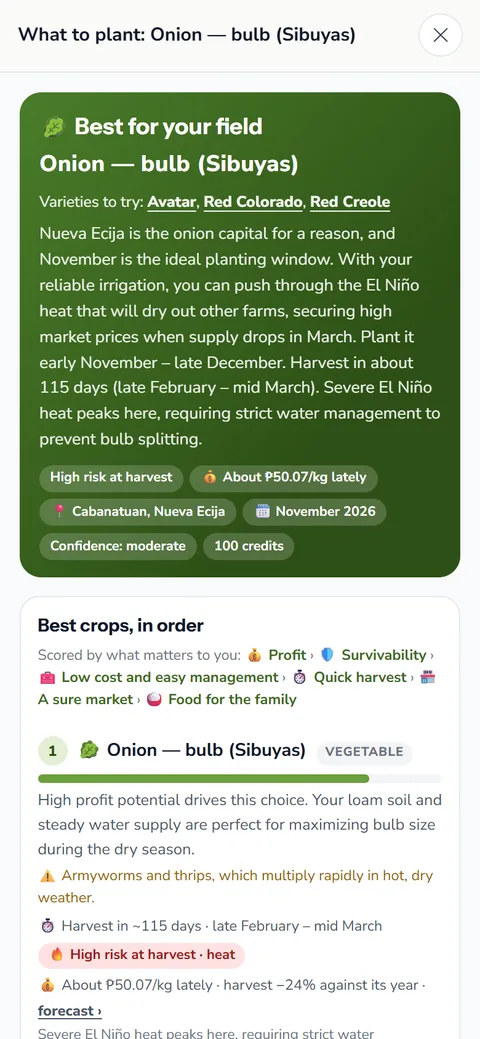
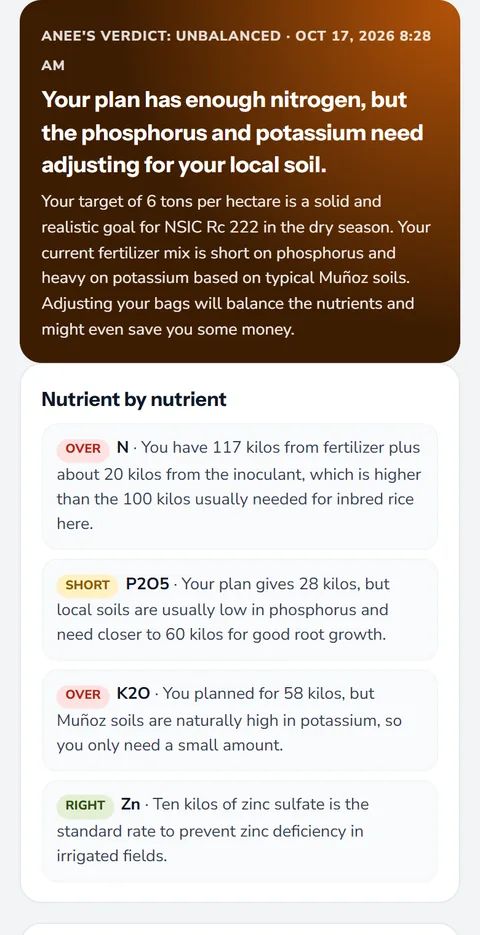
- Soil and What to do: the soil numbers, then actions marked now, this week or this month
A satellite reading is a guide. At 10 meters a pixel it cannot count plants or spot one sick hill. Use it to choose where to walk, then confirm on foot before you buy a spray. Our pest catalogue and disease catalogue help you name what you find.
Where satellite crop monitoring fits your season
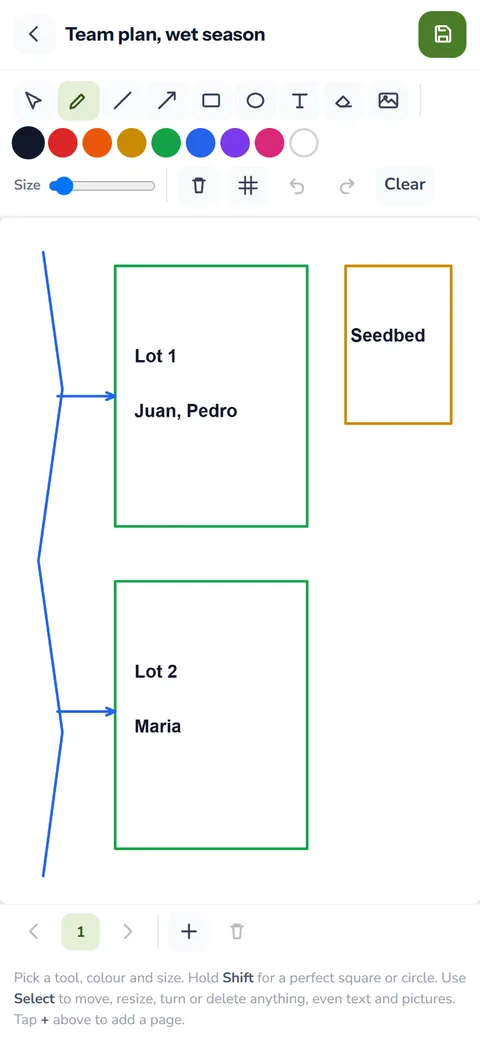
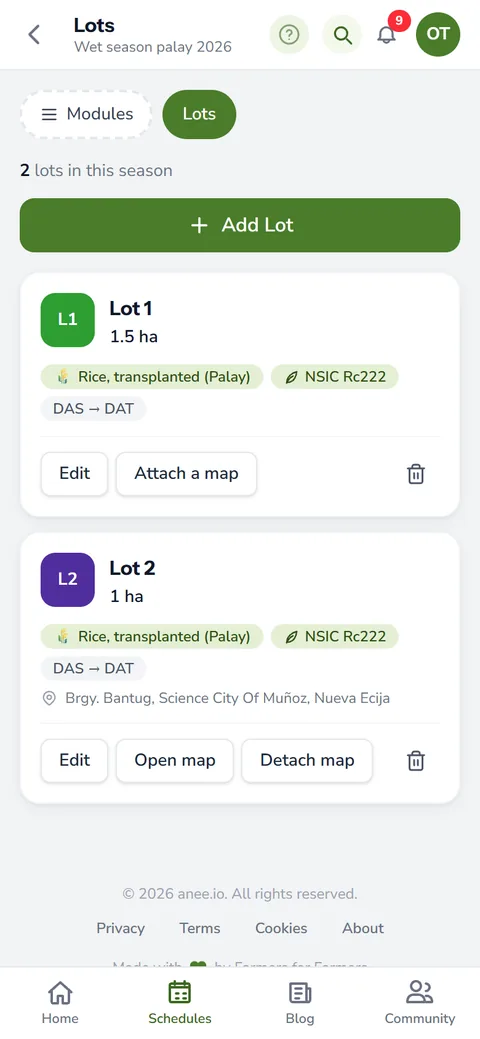
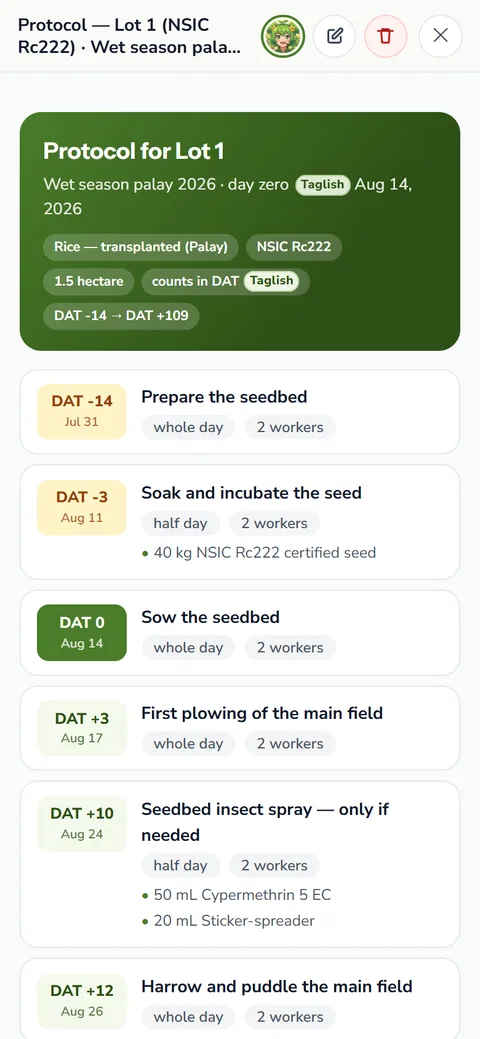
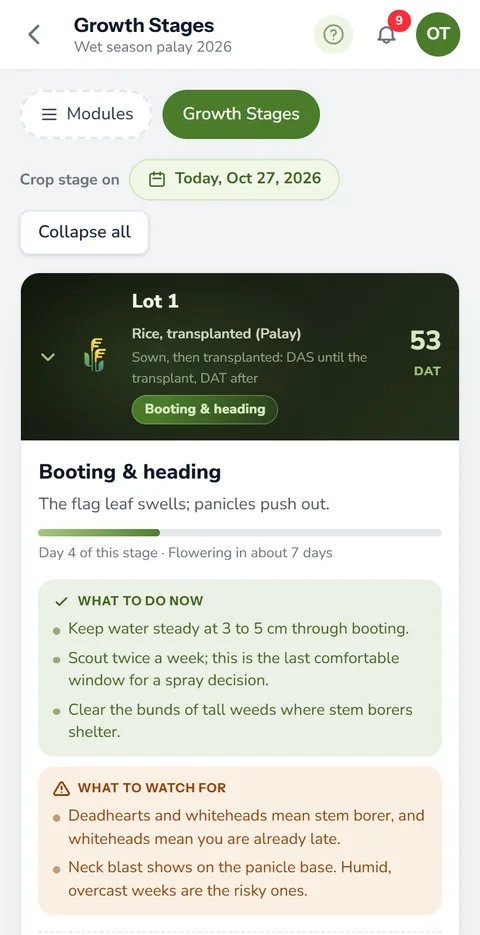
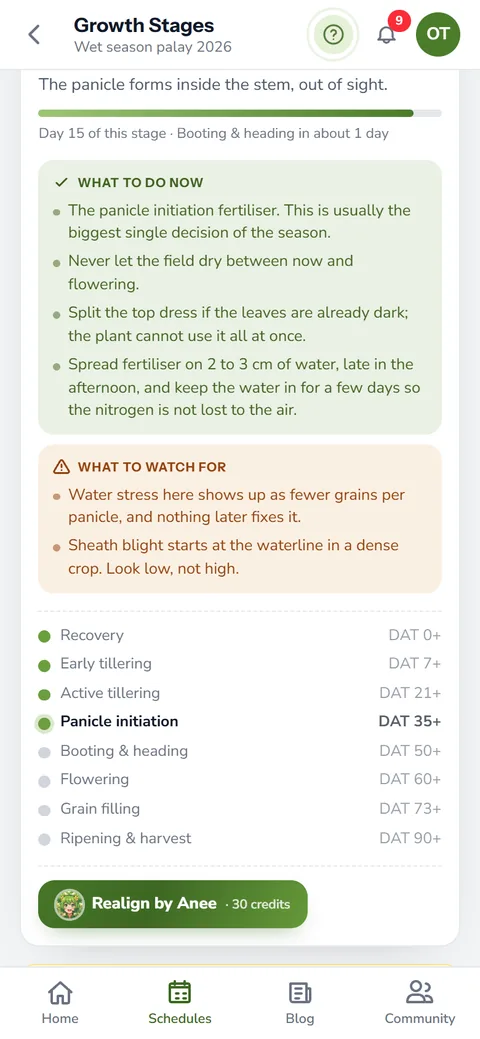
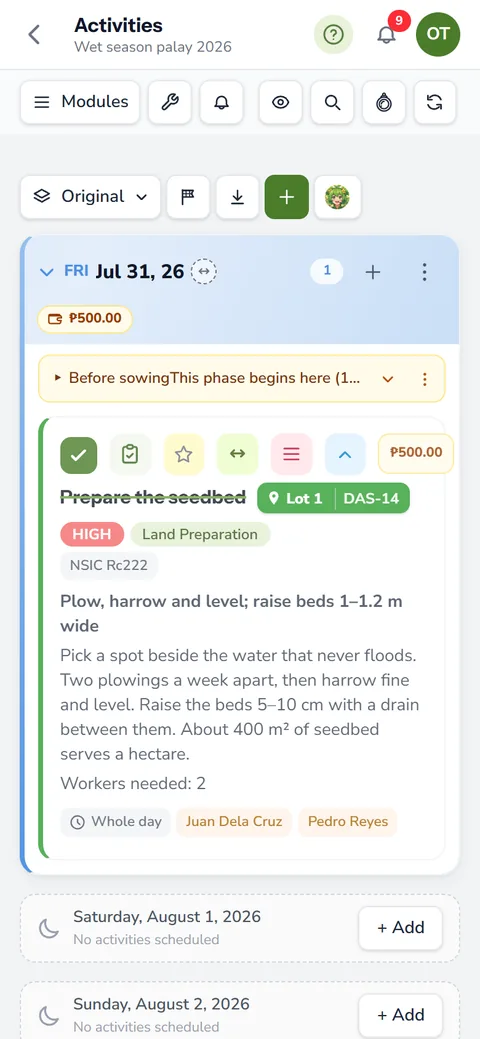
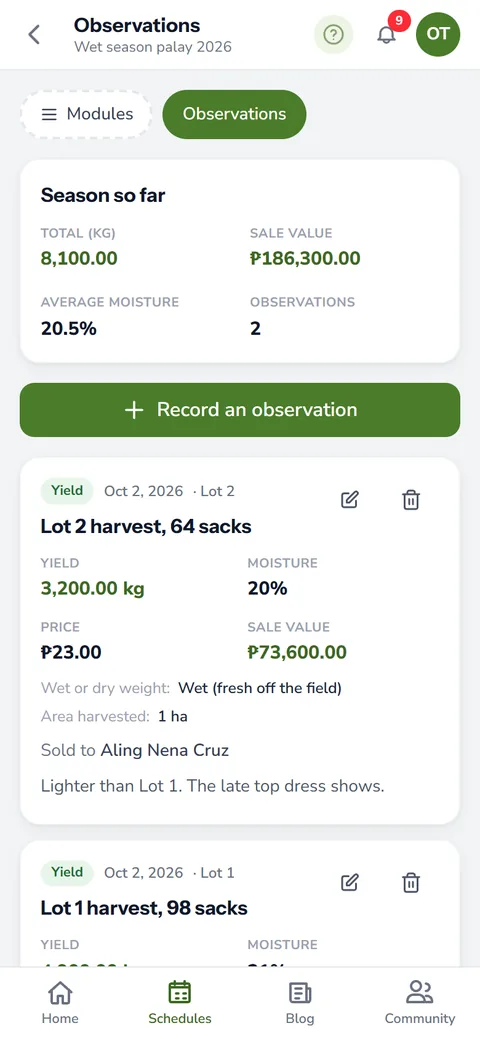
Satellite Analysis works beside the tools you already use. Your farm maps keep each field's outline for every season. Next, growth stages and weather say what each lot should be doing today, so you can hold the satellite reading against the calendar. If a lot runs behind, Realign by Anee shifts its stages to match.
Every report lands on the Saved tab, where you can search it and open it again.
Satellite Analysis comes with Libre plus Anee, Solo Farmer and Farm Owner. Each run uses credits, and the page shows the price and your balance first. The charge comes only when the report is ready. If neither satellite has passed over your field lately, the run stops and you pay nothing.
How satellite crop monitoring helps your crops and your farm
- See the whole field at once. Weak spots show up from above, even on a big farm.
- Find problems you cannot see from the dike. The field read in parts points to where to walk and check.
- Works through typhoon clouds. Radar sees the field when the clouds hide it.
- Know what to do next. Anee adds the threats and the next steps to the picture.
Sign up free, add Anee, and draw your first field for a satellite reading.
Create a free account