Crop Yield Forecasting: Can a Farm App Predict My Harvest Before I Cut?
Crop yield forecasting can give you a fair range before harvest, but no app can promise an exact number. Once the grains fill, count panicles and grains in a few small samples for a field estimate. A crop cut at harvest then gives the true figure. Built for Filipino farmers, the anee.io farm app does not predict an exact yield. Instead, it keeps each lot's past harvests and shows the yield your fertilizer plan can feed.
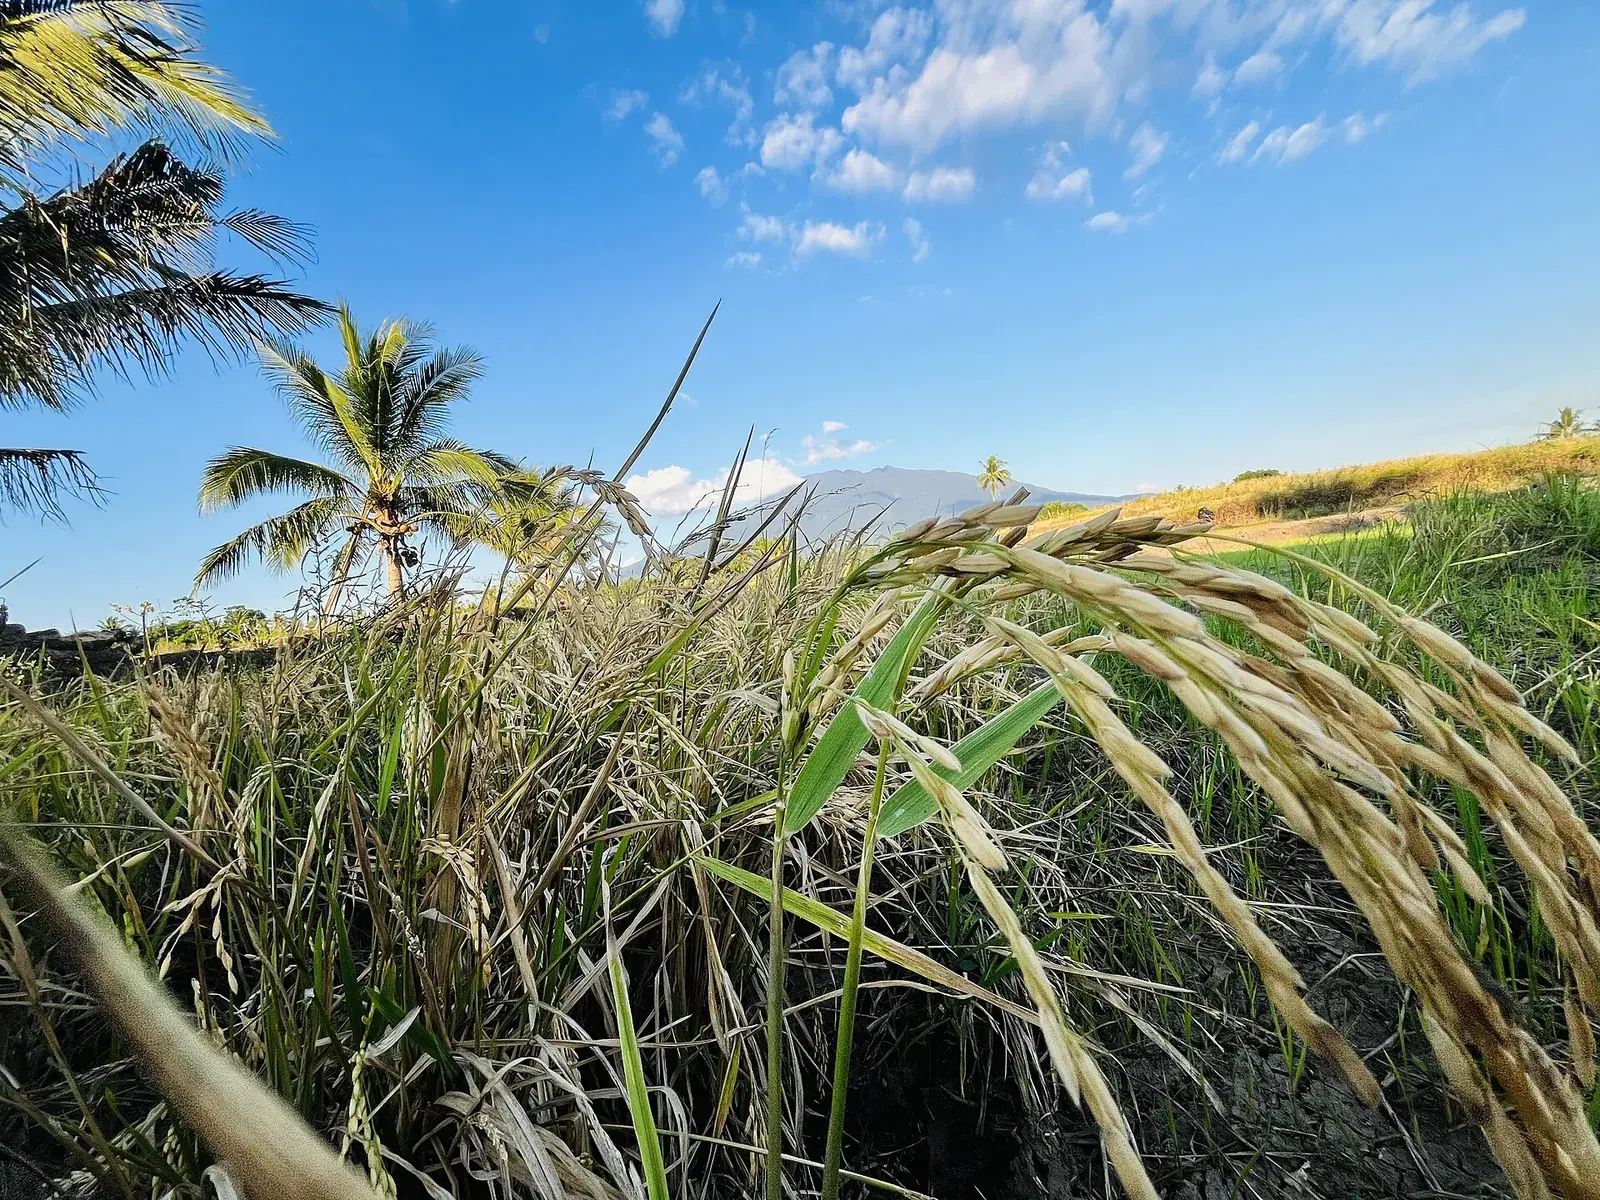
Every farmer wants to know the harvest early. The buyer asks, the lender asks, and reaping and drying need cash. So know what you can measure before harvest, and what an app can honestly add.
This guide uses palay, because researchers have studied its yield closely. The same idea works for mais and gulay too: weigh a measured sample, then scale it up.
Key points
- Crop yield is harvest per area, usually kilos, tons or cavans per hectare.
- Rice yield has four parts: panicles per square meter, grains per panicle, the share that fill, and grain weight.
- A count after the grains fill gives a range. A crop cut at harvest gives the true number.
- Satellites and weather show health and risk. They do not count grains.
- Your past harvests per lot are the best base for any forecast.
What is crop yield?
Crop yield is how much you harvest from a given area of land. Put more exactly, it is the harvested production per hectare of the area under cultivation. Filipino farmers say it in kilos, tons or cavans per hectare.
The per hectare part makes crop yields useful. For example, 50 cavans from half a hectare is 100 cavans per hectare. So a small lot compares fairly with a big one. Our page on ani meaning explains the Filipino word.
For rice, Shouichi Yoshida's textbook says the usual way to report yield is as palay at 14 percent moisture. It adds that grain yield usually ranges from 3 to 10 tons per hectare per crop, unless the crop lodges.
How do you estimate crop yield before harvest?
Break the yield into its parts. Yoshida splits rice yield into four, and the crop settles each one at a different stage. That is why a count after the grains fill tells you more than an early one.
| Yield part | When the crop settles it | What can still change it |
|---|---|---|
| Panicles per square meter | About 10 days after maximum tillering in transplanted rice | Tillering, spacing and lost hills |
| Grains per panicle | The reproductive stage, before heading | Nutrients and weather in those weeks |
| Share of filled grains | Before, at and after heading | Heat or cold at flowering, bad weather in ripening |
| Weight of 1,000 grains | Mostly the variety, since the hull limits grain size | Very little |
Count and compute, step by step
Take three small samples
Take three samples of 4 hills, 2 by 2. At 20 by 20 cm spacing, 4 hills cover 0.16 square meters.
Count the panicles
Add the panicles of the 4 hills, then divide by 0.16 to get panicles per square meter.
Count the grains
Thresh the sample and count filled and unfilled grains per panicle. Write the filled share as a decimal, like 0.85.
Get the grain weight
Weigh 1,000 dry filled grains. Without a fine scale, ask your seed source for the variety's figure.
Multiply and average
Multiply panicles per square meter, grains per panicle, the filled share and the 1,000 grain weight in grams. Divide by 100 for kilos per hectare, then average the three samples.
Yoshida shows the sum for IR8, an older variety. It assumes 250 panicles per square meter, 100 grains each, 85 percent filled and 29 grams per 1,000 grains. That gave 6.16 tons per hectare in the cloudy wet season. With 375 panicles in the sunny dry season, it gave 9.24 tons.
Treat it as a range, since yield parts only partly explain why one field outyields another.
Samples from the best looking spots read high. Pick crop cut areas with a good stand, and for a whole parcel, record the share of missing hills. Walk the weak spots too, and plan your cash on the lower figure.
How do you measure the real yield at harvest?
Weigh it. There are two ways, and both correct the weight to 14 percent moisture, because wet palay weighs more.
| Method | What you do | Sample |
|---|---|---|
| Crop cut | Harvest three areas of 5 square meters (2 by 2.5 m). Thresh, clean, dry, weigh, read moisture | 2.03 kg from 5 square meters at 14.1 percent moisture, about 4.1 tons per hectare |
| Whole parcel | Measure the parcel, count the sacks, weigh five random sacks and read moisture | 13 sacks of 51.8 kg from 1,250 square meters at 22.3 percent moisture, about 4.9 tons per hectare |
The sum is the same for both. Divide the kilos by the square meters and multiply by 10,000. Then multiply by 100 minus the moisture, and divide by 86.
Notice those sacks weighed 51.8 kg, not an even 50. So weigh a few before you sell by the cavan, as our palay price guide explains. For safe moisture, see palay drying.
Do farm management apps have crop yield forecasting tools?
Some do, mostly big farm platforms that mix satellite pictures, weather and crop models. But none can see your grains, so check any app forecast against a field count.
The government runs its own system for whole provinces. PRISM, the Philippine Rice Information System at PhilRice, lists rice area mapping and yield estimation among its work. It uses remote sensing and crop modeling, with the DA, PAGASA and IRRI among its partners. Its numbers help the DA plan, not one farmer manage a lot.
| Tool | What it tells you | What it misses |
|---|---|---|
| Panicle and grain count | A fair estimate once grains fill | Later losses from rats, lodging or rain |
| Crop cut or sack weighing | The true yield | Only at harvest |
| Satellite greenness | Weak and strong zones | Grain counts, and fields under cloud |
| Weather forecast | Risk at flowering and ripening | A number in kilos |
| Past harvest records | Your normal range per lot | Nothing, if kept well |
Weather matters most around flowering. Yoshida found that sunlight in the reproductive stage has the biggest effect on rice yield. Drought at flowering also leaves more empty grains. So the forecast for those weeks tells you more than any greenness map.
A satellite picture still shows where to walk, as our guides on satellite images of your farm and crop health without a drone explain.
How does anee.io help with crop yield forecasting?
anee.io does not predict an exact yield. Instead, it gives you the pieces for an honest estimate.
First, the NPK Plus Calculator adds up the nutrients in your fertilizer plan. It shows the harvest that fertilizer alone can feed and the nutrient that runs out first. Your soil adds its own share, so treat that line as a balance check.
Next, harvest records keep each lot's yield, moisture, wet or dry weight and area harvested. Then Compare Reports sets two seasons side by side, and Anee, the smart farm technician inside anee.io, explains what changed.
During the season, Satellite Analysis reads Sentinel 2 pictures and Sentinel 1 radar of a field you draw, and Anee names the weak spots. Growth stages show when each lot should flower, so you know which weeks to watch. NPK Plus comes with Libre plus Anee, Solo Farmer and Farm Owner, and Satellite Analysis uses credits on the same plans. Compare Reports also uses credits and needs Solo Farmer or Farm Owner.
Sign up free and record each lot's harvest with its moisture and area.
Start free