Can Satellite Images of My Farm Show Crop Health in the Philippines?
Yes, within limits. Free Sentinel 2 satellite images of my farm, or any farm in the Philippines, show how green and even a crop is, which part of a field is weaker, and when a field flooded. They cannot count plants or name a pest, because each pixel covers 10 by 10 meters, and clouds often hide the field in the rainy season. In anee.io, a farm app built for Filipino farmers, Satellite Analysis reads Sentinel 2 pictures and Sentinel 1 radar of a field you draw, and Anee tells you where to walk first.
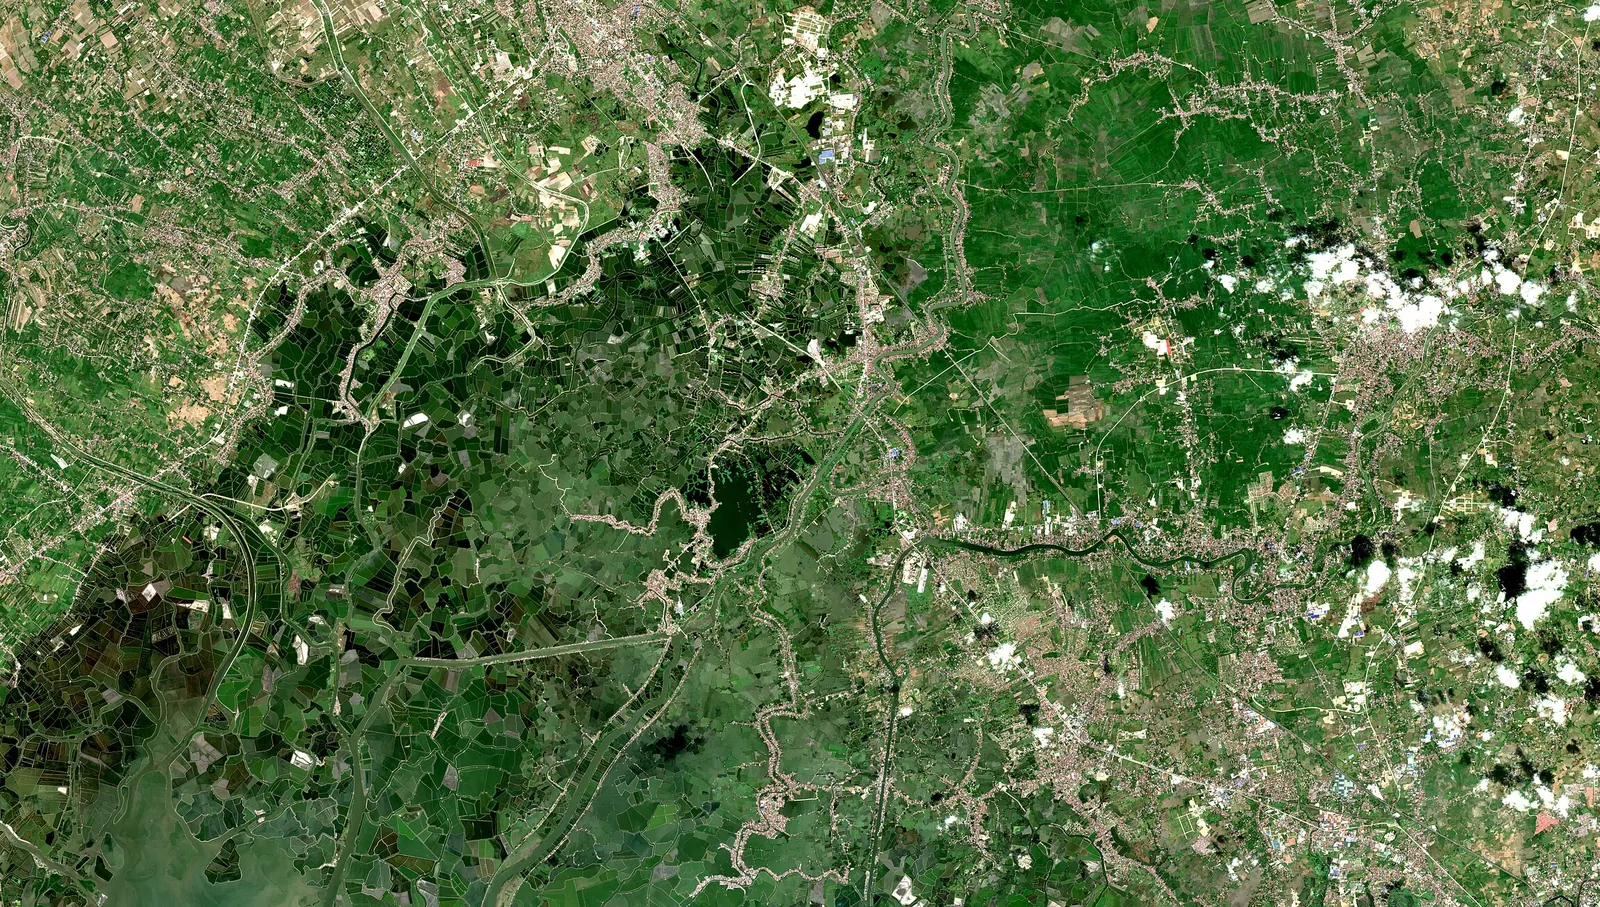
A satellite does not see your rice the way you do. It measures the light that bounces off the field, including near infrared light that our eyes cannot see. Healthy leaves reflect a lot of near infrared, so a dense green crop stands out from bare or stressed ground.
Two kinds of pictures matter for farms. Optical pictures from Sentinel 2 show color and greenness, with 13 bands of light and pixels as small as 10 meters. Radar from Sentinel 1 sends its own signal, so ESA says it works day or night and in any weather. That matters in a country where typhoon clouds can cover a field for days.
Key points
- Sentinel 2 passes about every five days near the equator, and its data are free under the Copernicus open data policy.
- Clouds block optical pictures, but Sentinel 1 radar sees through them.
- Satellites show where a field is weaker, not why. You still walk the spot to find the cause.
- PRISM is a satellite based rice monitoring system for planning, not for one farm.
- Satellite Analysis in anee.io reads both kinds of pictures for a field you draw, and it uses credits.
What can satellite images of my farm show?
Satellite apps often turn the red and near infrared light into NDVI, a greenness score. NASA explains that values near 0.8 to 0.9 mean the densest green leaves, while 0.1 and below mean barren areas such as rock or sand. A rice paddy moves along that scale through the season: low at transplanting, then higher as the canopy closes.
| What you see | What it can mean | What it cannot tell you |
|---|---|---|
| Greenness score (NDVI) | How dense and green the canopy is | Why it is high or low |
| A weak patch inside the field | Standing water, poor fertilizer spread, pests, disease or lodging | Which of these it is |
| Change over several weeks | The crop is growing, or it stalled | Anything on a day with clouds |
| Radar signal rising | Leaves and stems filling in, even under cloud | Color or nutrient problems |
| Water over the field | Flooding, or a field just irrigated | How deep it is |
The government uses the same idea at a larger scale. PRISM, the Philippine Rice Information System, uses remote sensing to map rice areas, planting dates, flooded rice areas and yields. It also assesses rice areas hit by flood or drought, to help government planning. So it works for whole provinces, not for the day to day care of your lot.
What can satellites not see?
- Single plants. A 10 m pixel covers 100 square meters, so one sick hill disappears in the average.
- Small lots well. One hectare holds about 100 pixels, and a quarter hectare only about 25, with the edge pixels mixed with bunds.
- The cause. A weak patch may be a rat colony, a low spot or a missed fertilizer pass. Only a walk tells you which.
- Under cloud. Optical pictures fail under cloud, which is common in the rainy season. Radar fills part of that gap.
- Soil numbers. A satellite does not replace a soil test of your own field.
How often do satellites pass over the Philippines?
ESA puts the Sentinel 2 revisit at 5 days at the equator when two satellites fly, or 10 days with one. Sentinel 1 radar repeats the same view every 6 days with two satellites and every 12 with one. In practice, you get a clear optical picture less often in the wet months, so radar readings carry more weight then.
For most crops, that rhythm is enough. Rice changes over weeks, not hours, so a reading every one or two weeks shows the trend. For storms that move by the hour, use a weather map instead, as our guide on how to track typhoons explains.
How do you read a satellite picture of your field?
Outline your field exactly
Trace the bunds over a satellite map so the reading covers your field and not the road or the neighbor's lot.
Check the picture's date
A clear picture from last week beats a cloudy one from yesterday. Note how old it is.
Compare zones inside the field
Look for a corner or strip that reads lower than the rest. Comparing with a neighbor planted on another day tells you little.
Hold it against the stage
A field at transplanting reads low because water and bare mud fill the pixels. The same field should read much higher once the canopy closes.
Walk the weak zone
Check the water, the leaves, the stems and the soil there. Our guide on how to monitor crop health without a drone lists what to look for.
Write it down and check again
Note what you found and look at the next clear picture to see if the patch closed.
Never buy a spray because a map shows a red patch. The same low reading can come from tungro, rats, deep water or a fertilizer gap, and each needs a different fix. Confirm on foot, then decide.
How does anee.io read satellite images of a farm?
First you trace each field over a satellite view with farm maps, and the app gives its area and the length of each side. Then Satellite Analysis reads the newest Sentinel 2 picture and Sentinel 1 radar of that field. Anee, the smart farm technician inside anee.io, weighs the weather, the El Nino or La Nina outlook and the soil of your area. She returns the crop's health, its weak spots and what to do next.
When clouds hide the field, the report reads the crop from radar. Each run uses credits and needs a plan with Anee, so the price shows before you start. The reading also sits well beside the growth stages of each lot, so you can compare what the satellite sees with what the calendar expects.
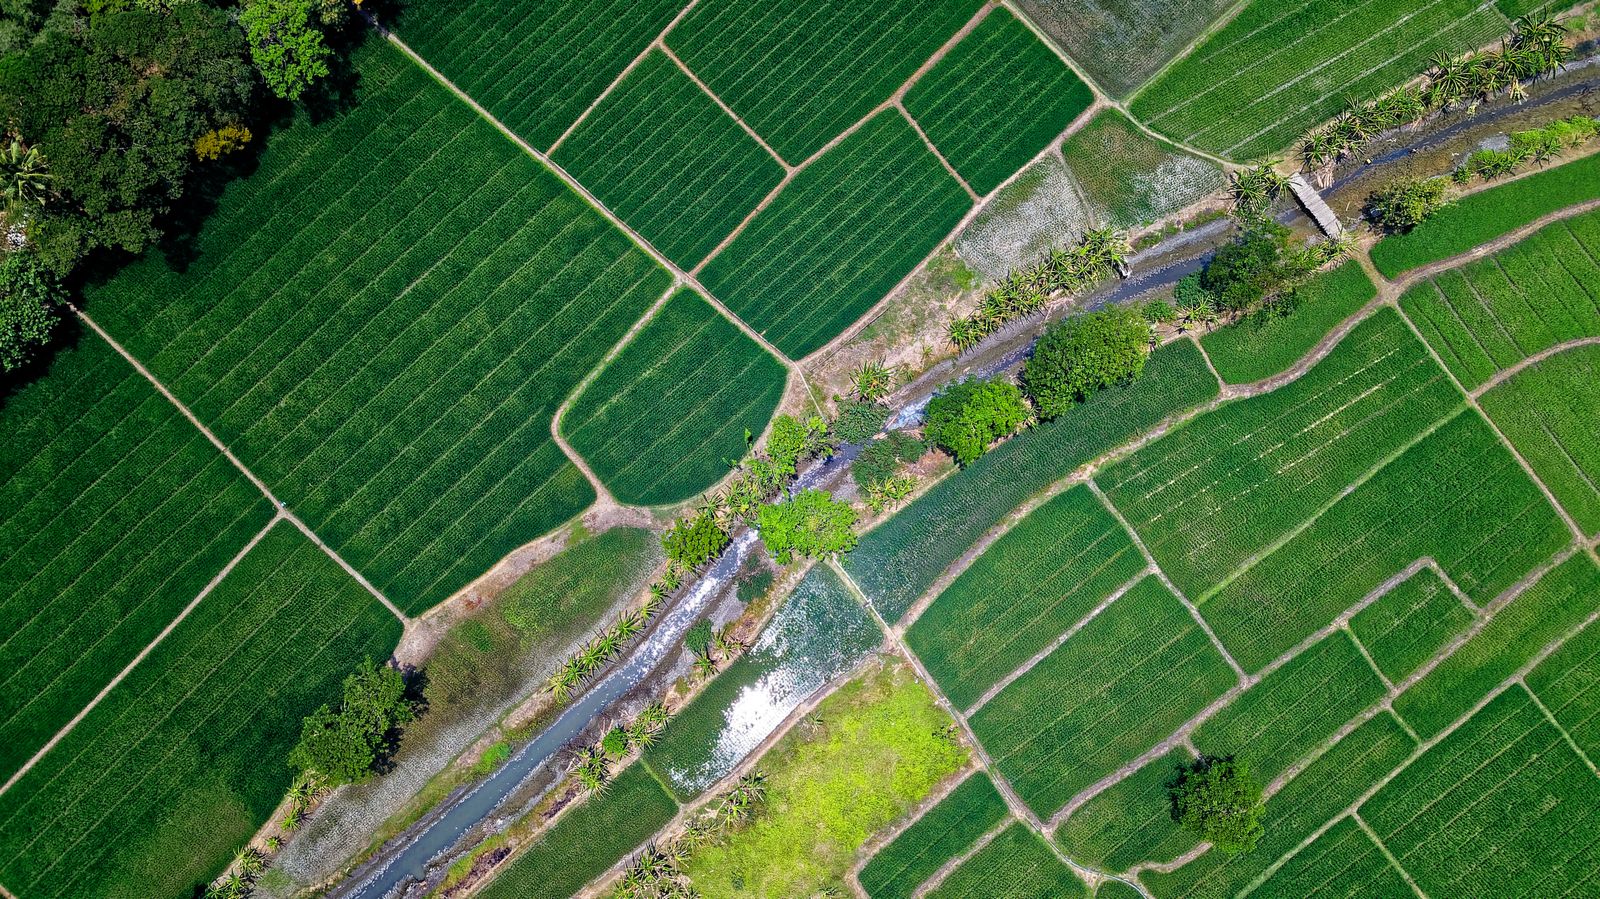
Draw your field once, and let Anee read the newest satellite and radar pictures with your weather and soil.
See Satellite AnalysisWhat does it cost?
The Sentinel data are free. Anyone can download them from the Copernicus Data Space website, though reading raw pictures takes skill and time. In anee.io, Satellite Analysis runs on credits and needs a plan with Anee: Libre plus Anee at PHP 70 a month, Solo Farmer at PHP 200 a month with 30 credits each renewal, or Farm Owner with 100. You can buy more credits when you need them, and the pricing page has the details.
The limits stay the same in any app. A satellite reading guides your walk. It does not replace it, and it never names a pest for you. For that, use the pest and disease finders or ask Anee with a photo.